参考:
Prometheus
官方文档
promethues-book
简介
Prometheus受启发于Google的Brogmon监控系统(相似的Kubernetes是从Google的Brog系统演变而来),从2012年开始由前Google工程师在Soundcloud以开源软件的形式进行研发,并且于2015年早期对外发布早期版本。2016年5月继Kubernetes之后成为第二个正式加入CNCF基金会的项目,同年6月正式发布1.0版本。2017年底发布了基于全新存储层的2.0版本,能更好地与容器平台、云平台配合
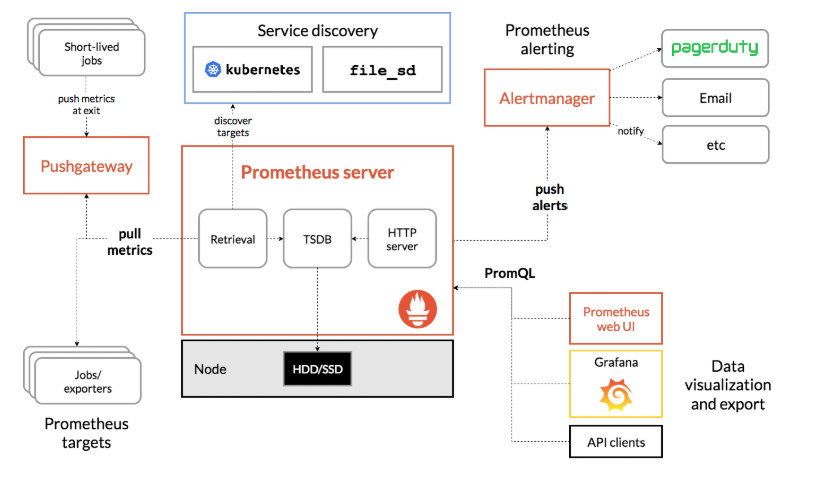
我们从官方站点上的一张图来认识下prometheus
-
Prometheus server 监控的服务端,提供了http server 服务, 存储数据的TSDB以及服务自动发现规则的检索。简单的web UI 界面。
-
PromQL 内置的数据查询语言, 其提供对时间序列数据丰富的查询,聚合以及逻辑运算能力的支持
-
Alertmanager 基于PromQL创建告警规则,如果满足PromQL定义的规则,则会产生一条告警,而告警的后续处理流程则由AlertManager进行管理
-
Exporter 将监控数据采集的端点通过HTTP服务的形式暴露给Prometheus Server,Prometheus Server通过访问该Exporter提供的Endpoint端点,即可获取到需要采集的监控数据。
-
直接采集 应用内置了对prometheus的支持,直接把监控数据暴漏出来
应用内置了对prometheus的支持,直接把监控数据暴漏出来
-
简接采集 应用不支持直接对prometheus, 需要我们安装对应的exporter 如nginx exporter , Consul exporter
应用不支持直接对prometheus, 需要我们安装对应的exporter 如nginx exporter , Consul exporter
-
Pushgateway 由于Prometheus都是基于PULL模型,有时被采集端并不支持提供http server, 这个时候就需要pushgateway来进行中转。数据通过pushgateway提供给prometheus
-
Service Discovery 服务自动发现功能 prometheus各种SD 如下所示:
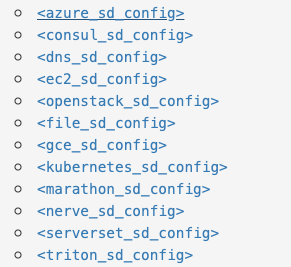
consul_sd_config 是使用consul存储被监控端的信息
file_sd_config 是使用文件来存储被监控端的信息,json格式
Prometheus的优势
-
易于管理
Prometheus核心部分只有一个单独的二进制文件,不存在任何的第三方依赖(数据库,缓存等等)。唯一需要的就是本地磁盘,因此不会有潜在级联故障的风险。
Prometheus基于Pull模型的架构方式,可以在任何地方(本地电脑,开发环境,测试环境)搭建我们的监控系统。对于一些复杂的情况,还可以使用Prometheus服务发现(Service Discovery)的能力动态管理监控目标。
-
监控服务内部
Pometheus鼓励用户监控服务的内部状态,基于Prometheus丰富的Client库,用户可以轻松的在应用程序中添加对Prometheus的支持,从而让用户可以获取服务和应用内部真正的运行状态。
-
强大的数据类型
所有采集的监控数据均以指标(metric)的形式保存在内置的时间序列数据库当中(TSDB)。所有的样本除了基本的指标名称以外,还包含一组用于描述该样本特征的标签。如下所示:
1
2
3
|
http_request_status{code='200',content_path='/api/path', environment='produment'} => [value1@timestamp1,value2@timestamp2...]

http_request_status{code='200',content_path='/api/path2', environment='produment'} => [value1@timestamp1,value2@timestamp2...]
|
每一条时间序列由指标名称(Metrics Name)以及一组标签(Labels)唯一标识。
每条时间序列按照时间的先后顺序存储一系列的样本值。
表示维度的标签可能来源于你的监控对象的状态,比如code=404或者content_path=/api/path。也可能来源于的你的环境定义,比如environment=produment。基于这些Labels我们可以方便地对监控数据进行聚合,过滤,裁剪。
-
强大的查询语言promQL
Prometheus内置了一个强大的数据查询语言PromQL。 通过PromQL可以实现对监控数据的查询、聚合。同时PromQL也被应用于数据可视化(如Grafana)以及告警当中。
通过PromQL可以轻松回答类似于以下问题:
-
在过去一段时间中95%应用延迟时间的分布范围?
-
预测在4小时后,磁盘空间占用大致会是什么情况?
-
CPU占用率前5位的服务有哪些?(过滤)
-
高效
对于监控系统而言,大量的监控任务必然导致有大量的数据产生。而Prometheus可以高效地处理这些数据,对于单一Prometheus Server实例而言它可以处理:
-
数以百万的监控指标
-
每秒处理数十万的数据点。
-
可扩展
Prometheus是如此简单,因此你可以在每个数据中心、每个团队运行独立的Prometheus Sevrer。Prometheus对于联邦集群的支持,可以让多个Prometheus实例产生一个逻辑集群,当单实例Prometheus Server处理的任务量过大时,通过使用功能分区(sharding)+联邦集群(federation)可以对其进行扩展。
远程存储读写
-
易于集成
使用Prometheus可以快速搭建监控服务,并且可以非常方便地在应用程序中进行集成。
目前支持: Java, JMX, Python, Go,Ruby, .Net, Node.js等等语言的客户端SDK,基于这些SDK可以快速让应用程序纳入到Prometheus的监控当中,或者开发自己的监控数据收集程序。同时这些客户端收集的监控数据,不仅仅支持Prometheus,还能支持Graphite这些其他的监控工具。
同时Prometheus还支持与其他的监控系统进行集成:Graphite, Statsd, Collected, Scollector, muini, Nagios等。
Prometheus社区还提供了大量第三方实现的监控数据采集支持:JMX, CloudWatch, EC2, MySQL, PostgresSQL, Haskell, Bash, SNMP, Consul, Haproxy, Mesos, Bind, CouchDB, Django, Memcached, RabbitMQ, Redis, RethinkDB, Rsyslog等等。
-
可视化
自带UI。
也可以使用Grafana
-
开放性
支持多种输出格式,不局限于prometheus提供的格式,也可以输出到Graphite
不足之处
- 单点,无集群模式
- 只支持对数字类型的监控,不支持text,( infludb支持text存储)
- 时间无法本地化
安装
下载 官方下载 Version:2.14.0
 1
 2
 3
 4
 5
 6
 7
 8
 9
10
11
12
13
14
|
$ wget https://github.com/prometheus/prometheus/releases/download/v2.14.0/prometheus-2.14.0.linux-amd64.tar.gz
$ tar xvf prometheus-2.14.0.linux-amd64.tar.gz -C /usr/local/
$ cd /usr/local/
$ ln -sv prometheus-2.14.0.linux-amd64 prometheus # 软链接
$ cd prometheus
$ ls -l
drwxr-xr-x 2 3434 3434       36 Nov 12 00:17 console_libraries
drwxr-xr-x 2 3434 3434     4096 Nov 12 00:17 consoles
-rw-r--r-- 1 3434 3434    11357 Nov 12 00:17 LICENSE
-rw-r--r-- 1 3434 3434     3184 Nov 12 00:17 NOTICE
-rwxr-xr-x 1 3434 3434 80046526 Nov 11 22:29 prometheus  # 核心服务二进制文件
-rw-r--r-- 1 3434 3434      926 Nov 12 00:17 prometheus.yml # 核心服务的配置文件
-rwxr-xr-x 1 3434 3434 47302797 Nov 11 22:30 promtool  # prometheus监控的工具,用来检测metrics,测试配置文件是否可用等
-rwxr-xr-x 1 3434 3434 13502492 Nov 11 22:30 tsdb # 新增加的一个查看和压测tsdb的命令行工具
|
prometheus 命令行参数详解
 1
 2
 3
 4
 5
 6
 7
 8
 9
10
11
12
13
14
15
16
17
18
19
20
21
22
23
24
25
26
27
28
29
30
31
32
33
34
35
36
37
38
39
40
41
|
usage: prometheus [<flags>]
The Prometheus monitoring server
Flags:
  -h, --help                     帮助信息
      --version                  显示版本信息
      --config.file="prometheus.yml" 指定配置文件 默认为prometheus.yml
      --web.listen-address="0.0.0.0:9090" Web端监听的地址和端口
      --web.read-timeout=5m      读请求和关闭空闲链接的超时时间
      --web.max-connections=512  web 最大的连接数
      --web.external-url=<URL>   外部url.
      --web.route-prefix=<path>  前缀地址  Defaults to path of --web.external-url.
      --web.user-assets=<path>   Path to static asset directory, available at /user.
      --web.enable-lifecycle     允许通过http访问来reload 或 关闭 promethues.
      --web.enable-admin-api     Enable API endpoints for admin control actions.
      --web.console.templates="consoles" Path to the console template directory, available at /consoles.
      --web.console.libraries="console_libraries" Path to the console library directory.
      --web.page-title="Prometheus Time Series Collection and Processing Server" Document title of Prometheus instance.
      --web.cors.origin=".*"     Regex for CORS origin. It is fully anchored. Example: 'https?://(domain1|domain2)\.com'
      --storage.tsdb.path="data/"  数据存储路径
      --storage.tsdb.retention=STORAGE.TSDB.RETENTION 数据存放时间 到3.0版本后被废弃 use "storage.tsdb.retention.time" instead.
      --storage.tsdb.retention.time=STORAGE.TSDB.RETENTION.TIME 数据存放时间 会覆盖"storage.tsdb.retention" time defaults to 15d.
      --storage.tsdb.retention.size=STORAGE.TSDB.RETENTION.SIZE 数据存储大小支持: KB, MB, GB, TB, PB [实验性参数]
      --storage.tsdb.no-lockfile 不设置锁文件在数据目录中
      --storage.tsdb.allow-overlapping-blocks 允许覆盖数据块  [实验性参数]
      --storage.tsdb.wal-compression 压缩 tsdb WAL
      #
      --storage.remote.flush-deadline=<duration> 刷新时间是多久 在关闭或重载配置时
      --storage.remote.read-sample-limit=5e7 远程读设置最大个数
      --storage.remote.read-concurrent-limit=10 Maximum number of concurrent remote read calls. 0 means no limit.
      --storage.remote.read-max-bytes-in-frame=1048576 Maximum number of bytes in a single frame for streaming remote read response types before marshalling. Note that client might have limit on frame size as well. 1MB as recommended by protobuf by default.
      --rules.alert.for-outage-tolerance=1h 最大时间容忍prometheus停电恢复 for 状态警报。
      --rules.alert.for-grace-period=10m 警报和恢复“for”状态之间的最小持续时间。仅对配置“for”时间大于宽限期的警报维护此功能。
      --rules.alert.resend-delay=1m 在向Alertmanager重新发送警报之前需要等待的最短时间。
      --alertmanager.notification-queue-capacity=10000 队列中等待的Alertmanager通知的容量。
      --alertmanager.timeout=10s 发送告警到alertmanager的超时时间
      --query.lookback-delta=5m  表达式求值期间检索指标的最大回滚持续时间。
      --query.timeout=2m         查询超时时间
      --query.max-concurrency=20 并发执行的最大查询数
      --query.max-samples=50000000 单个查询可以加载到内存中的样本的最大数量
      --log.level=info           日志级别: [debug, info, warn, error]
      --log.format=logfmt        日志输出格式: [logfmt, json]
|
Prometheus 配置文件详解
 1
 2
 3
 4
 5
 6
 7
 8
 9
10
11
12
13
14
15
16
17
18
19
20
21
22
23
24
25
26
27
28
29
30
31
32
33
34
35
36
37
38
39
40
41
42
43
44
45
46
47
48
49
50
51
52
53
54
55
56
57
58
59
60
61
62
63
64
65
66
67
68
69
|
# 全局配置
global:
  scrape_interval:     15s # 抓取频率为15s 默认1分钟
  evaluation_interval: 15s # 每15读取规则文件 . 默认1分钟

  # 在与外部系统(联邦、远程存储、Alertmanager)通信时,将这些标签附加到任何时间序列或警报上。
  external_labels:
      monitor: 'monitor-prd'

# Alertmanager configuration
alerting:
  alertmanagers:
  - static_configs:
    - targets:
      - 127.0.0.1:9093

# Load rules once and periodically evaluate them according to the global 'evaluation_interval'.
rule_files:
  # - "first.rules.yml"
  # - "second.rules.yml"
  - "alert.rules.yml"

# 抓取配置
scrape_configs:
  # The job name is added as a label `job=<job_name>` to any timeseries scraped from this config.
  - job_name: 'prometheus'

    # metrics_path defaults to '/metrics'
    # scheme defaults to 'http'.
		# 静态配置
    static_configs:
      - targets: ['127.0.0.1:9090']
        labels:
          group: 'prometheus'
  # 配置consul_sd_config  需要事先把consul集群配置好
  - job_name: 'prometheus-consul'
    consul_sd_configs:
    - server: '127.0.0.1:8500' # consul的服务地址
      datacenter: prometheus  # 数据中心名称
      services: ['linux']
    relabel_configs:
    - source_labels: ['__meta_consul_service']  # 读取服务
      regex: '(.*)'
      target_label: 'job'
      replacement: '$1'
    - source_labels: ['__meta_consul_node']  # 读取节点
      regex: '(.*)'
      target_label: 'instance'
      replacement: '$1'
    - source_labels: ['__meta_consul_tags']  # 读取tag
      regex: ',(.*),'
      target_label: 'group'
      replacement: '$1'

  # 配置文件file_sd_config  这里配置了blackbox_exporter
  - job_name: 'slb'
    scrape_interval: 30s
    metrics_path: /probe
    params:
      module: [tcp_connect]
    file_sd_configs:
    - files: ["/usr/local/prometheus/net.json"]
    relabel_configs:
    - source_labels: [__address__]
      target_label: __param_target
    - source_labels: [__param_target]
      target_label: instance
    - target_label: __address__
      replacement: 127.0.0.1:9115  # Blackbox 地址
|
检测配置文件
使用promtool工具进行检测
1
|
/usr/local/prometheus/promtool check config /usr/local/prometheus/prometheus.yml
|
配置服务启动脚本
 1
 2
 3
 4
 5
 6
 7
 8
 9
10
11
12
13
14
15
16
17
18
19
|
$ useradd prometheus # 增加用户
$ chown prometheus.prometheus /usr/local/prometheus -R
$ mkdir /data_prometheus
$ chow prometheus.prometheus /data_prometheus -R
$ cat /usr/lib/systemd/system/prometheus.service
[Unit]
Description=prometheus
After=network.target
[Service]
LimitCORE=infinity
LimitNOFILE=65535
LimitNPROC=65535
Type=simple
User=prometheus
Group=prometheus
ExecStart=/usr/local/prometheus/prometheus --config.file=/usr/local/prometheus/prometheus.yml --storage.tsdb.path=/data_prometheus --storage.tsdb.retention.time=7d --storage.tsdb.no-lockfile --alertmanager.timeout=10s --log.level=info --web.enable-lifecycle --query.max-concurrency=100 --web.max-connections=1024 --log.format=json --web.enable-admin-api
Restart=on-failure
[Install]
WantedBy=multi-user.target
|
启动
1
2
|
systemctl start prometheus
systemctl enabled prometheus  # 添加开机自启
|
被监控端配置
被监控端需要安装exporter 或应用程序(已直接支持prometheus)
常用exporter如下:
- node_exporter 主机监控,基础监控
- blackbox_exporter 黑盒监控 可以监控http, https, dns,tcp,icmp
- mysqld_exporter 监控mysql服务
还有大量第三方的expoter, 也可以自行开发适合自己的exporter
Telegraf
官方站点
我们这里是使用的telegraf ,其不但支持基础的监控也支持很多应用的监控,prometheus只需要从一个端口中就可以获得主机上的所有监控信息
也是go语言开发,是一个二进制文件,安装上很方便。支持大量的插件
使用consul来保存监控主机的信息
只需要把主机信息注册到consul中,注册如下所示:
 1
 2
 3
 4
 5
 6
 7
 8
 9
10
11
12
13
14
15
16
17
18
19
|
# 组合数据
# json数据
ajson = '{
    "ID": "唯一uuid",
    "Address":"主机ip地址",
    "Node":"主机ip地址",
    "Service":{
        "Service":"PRD-linux", # 服务名称
        "ID":"主机的hostname",
        "tags":["主机的标签"], #
        "port":1239,  # 监听的端口
        "address":"主机ip地址"
    }
}'

# 开始注册
curl -s -m 5 -X PUT -d "$ajson" consul_url/v1/catalog/register
# 查看注册的节点
curl -s consul_url/v1/catalog/node/主机ip地址
|
注册后, prometheus监控信息如下:
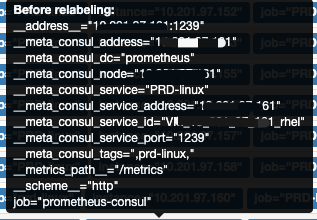
__address__ 是 组合后的监控地址和端口 __meta* 即对应的是consul的注册信息
如果要删除一个台主机监控,则只需要把主机从consul中清理掉即可
1
|
curl -X PUT -d '{\"Node\": \"主机ip地址\"}' consul_url/v1/catalog/deregister
|
使用文件(file_sd_config)来保存监控主机信息
1
2
3
4
|
# 在主配置文件中有这样一段配置
file_sd_configs:
    - files: ["/usr/local/prometheus/net.json"]
|
这个我们做的tcp端口的监控,我们只需要监控目标的端口是否正常即可,所以文件的配置信息如下:
 1
 2
 3
 4
 5
 6
 7
 8
 9
10
11
12
13
14
15
16
17
18
19
|
[
    {
        "labels": {
            "group": "slb"
        },
        "targets": [
            "目标ip1:port"
        ]
    },
  	{
        "labels": {
            "group": "slb"
        },
        "targets": [
            "目标ip2:port"
        ]
    }

]
|
Alertmanager 发送告警
prometheus通过一定规则配置后,把符合规则的信息发送到alermanager, alertmanager则把告警信息发送出去
alertmanager 安装
安装方法与prometheus相似,也是一个二进制文件
配置文件如下:
 1
 2
 3
 4
 5
 6
 7
 8
 9
10
11
12
13
14
15
16
17
18
19
20
21
22
23
24
25
26
27
28
29
30
31
32
33
34
35
36
37
38
39
40
41
42
43
44
45
46
47
48
49
50
|
global:
  # 配置发送邮件的信息
  smtp_smarthost: 'smtp.163.com:25'
  smtp_from: 'zhou_mfk@163.com'
  smtp_auth_username: 'zhou_mfk@163.com'
  smtp_auth_password: 'passwd'
# The directory from which notification templates are read.
templates:  # 指定模板
# - '/etc/alertmanager/template/*.tmpl'
  - '/usr/local/alertmanager/devmy.tmpl'
# 路由规则
route:
	# 告警分组 按告警名称和主机组来分
  group_by: ['alertname', 'group']
  group_wait: 10s
  group_interval: 1m
  repeat_interval: 8763h  # 重复发送告警的间隔时间 配置这个时间也即是发送一条告警
  receiver: PRD  # 默认的接收者
	# 使用正则可以把不同的告警发送到不同的接收者
  routes:
    - match_re:
        alertname: ^(SLB_Port_Down)$
      receiver: zls

# 告警抑制
# inhibit_rules:
# - source_match:
#     severity: 'critical'
#   target_match:
#     severity: 'warning'
#   # Apply inhibition if the alertname is the same.
#   equal: ['alertname', 'cluster', 'service']

# 配置告警接收者
receivers:
- name: 'noc'
  email_configs:
  - to: 'lishan.zhou@export.com'
  - to: 'xxxx@export.com'
    send_resolved: true   # 是否发送恢复

# webhook的配置
- name: 'PRD'
  webhook_configs:
  - url: 'http://your_url/v2/receive/'
    send_resolved: true
- name: 'zls'
  webhook_configs:
  - url: 'https://your_url/monitor/slb'
    send_resolved: true
|
告警规则
主要是使用promQL语言 这个规则是配置在prometheus下面的,不是配置在alertmanager下面的。
 1
 2
 3
 4
 5
 6
 7
 8
 9
10
11
12
13
14
15
16
17
18
19
20
21
22
23
24
25
26
27
28
|
groups:
- name: alert.rules  # 告警组名,一个组下面可以有多个规则
  rules:
  - alert: HostDown_is_0  # 告警规则名称
    expr: up{job=~"prd-nginx|PRD-linux"} == 0  # 告警表达式 promQL语言
    for: 2m   # 持续的时间
    labels:   # 告警的标签信息
      alert_type: system
      monitor: up
      serverity: critical
      current_value: '{{ $value }}'
    annotations:  # 告警的描述信息
      description: '{{ $labels.instance }} of group {{ $labels.job }} has been down for more than 5 minutes.'
      recovery: Recovery! Host {{ $labels.instance }} status UP
      summary: 'Host {{ $labels.instance }} status Down current value: {{ $value }}'

  - alert: DiskSpaceUsed_GT_80
    expr: (disk_used_percent{fstype!="iso9660"} > 80 and disk_free{fstype!="iso9660"} < 2.147483648e+10)
    for: 5m
    labels:
      alert_type: app
      monitor: disk_used_percent
      serverity: warning
      current_value: '{{ $value }}'
    annotations:
      description: '{{$labels.instance }} of group {{ $labels.group }}'
      recovery: Recovery! Host {{ $labels.instance }} Disk Space less than 80% and more than 20GB.
      summary: 'Host {{ $labels.host }} Device {{ $labels.device }} Mountpoint is {{ $labels.path }} Disk Space current value: {{ $value }}% and Free Space less than 20GB'
|